
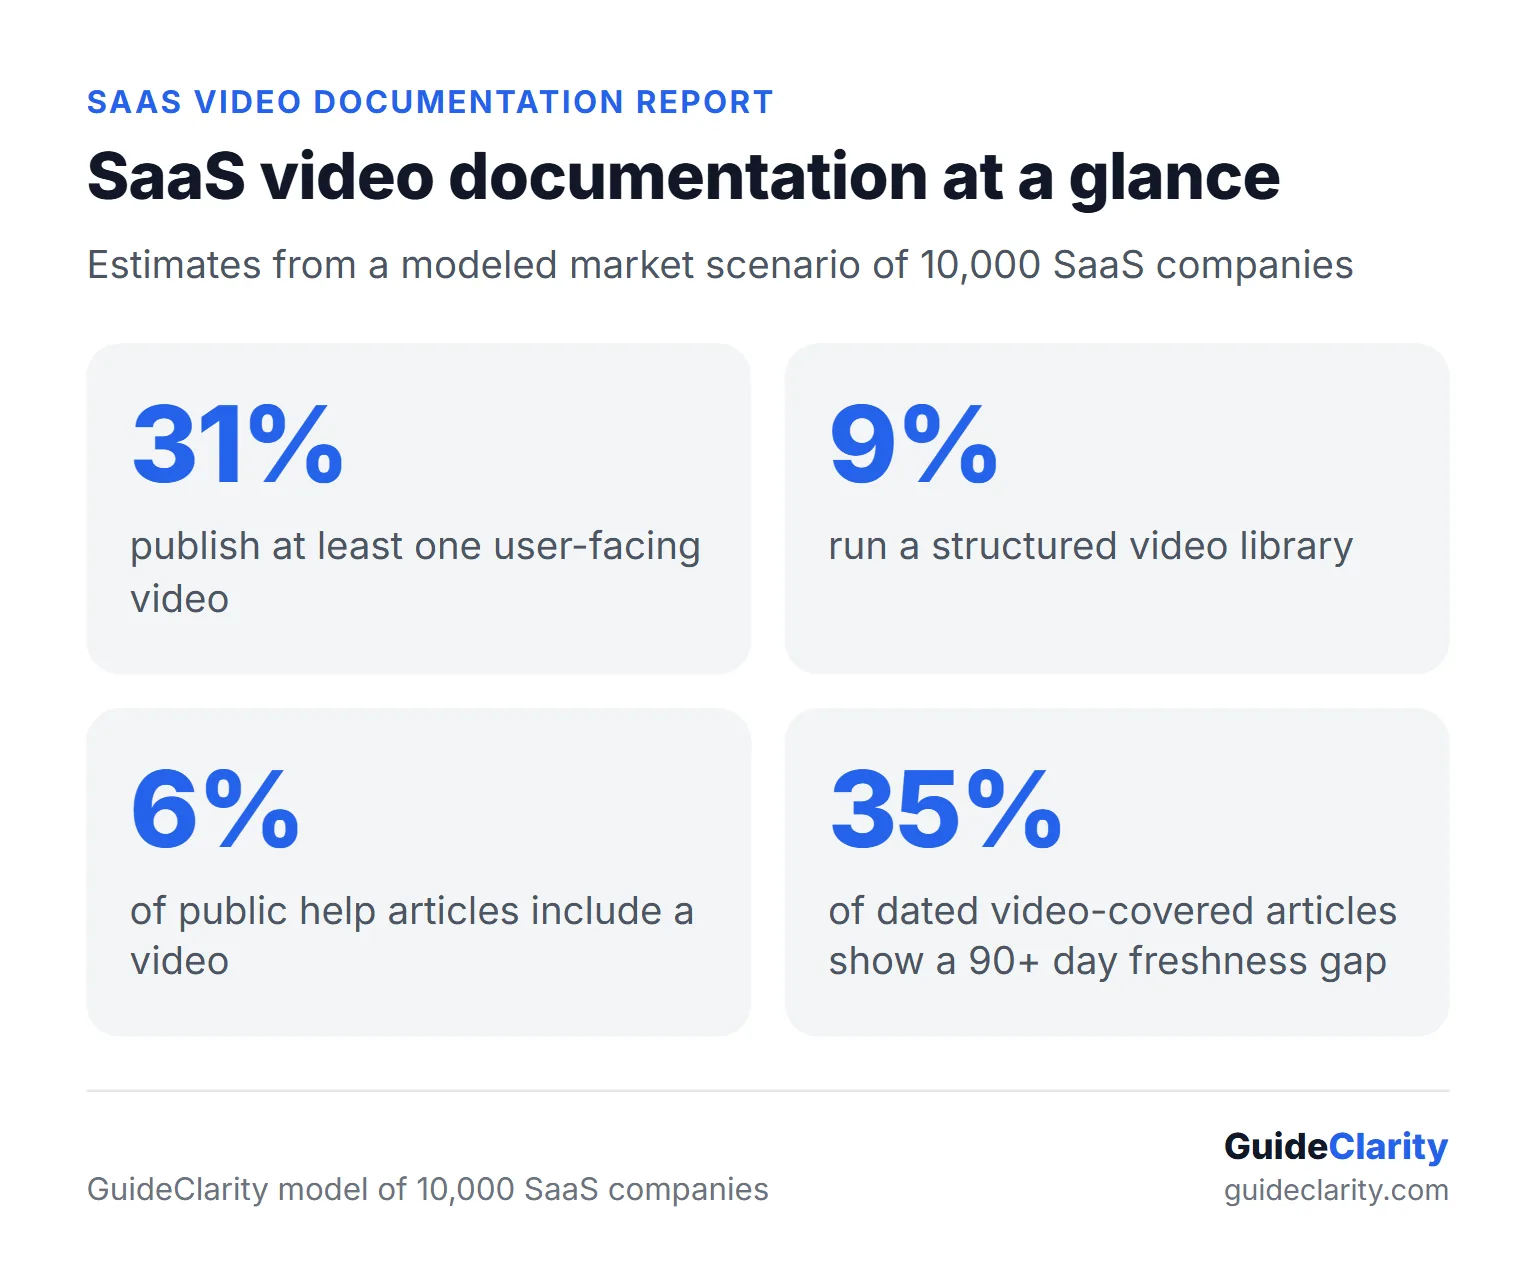
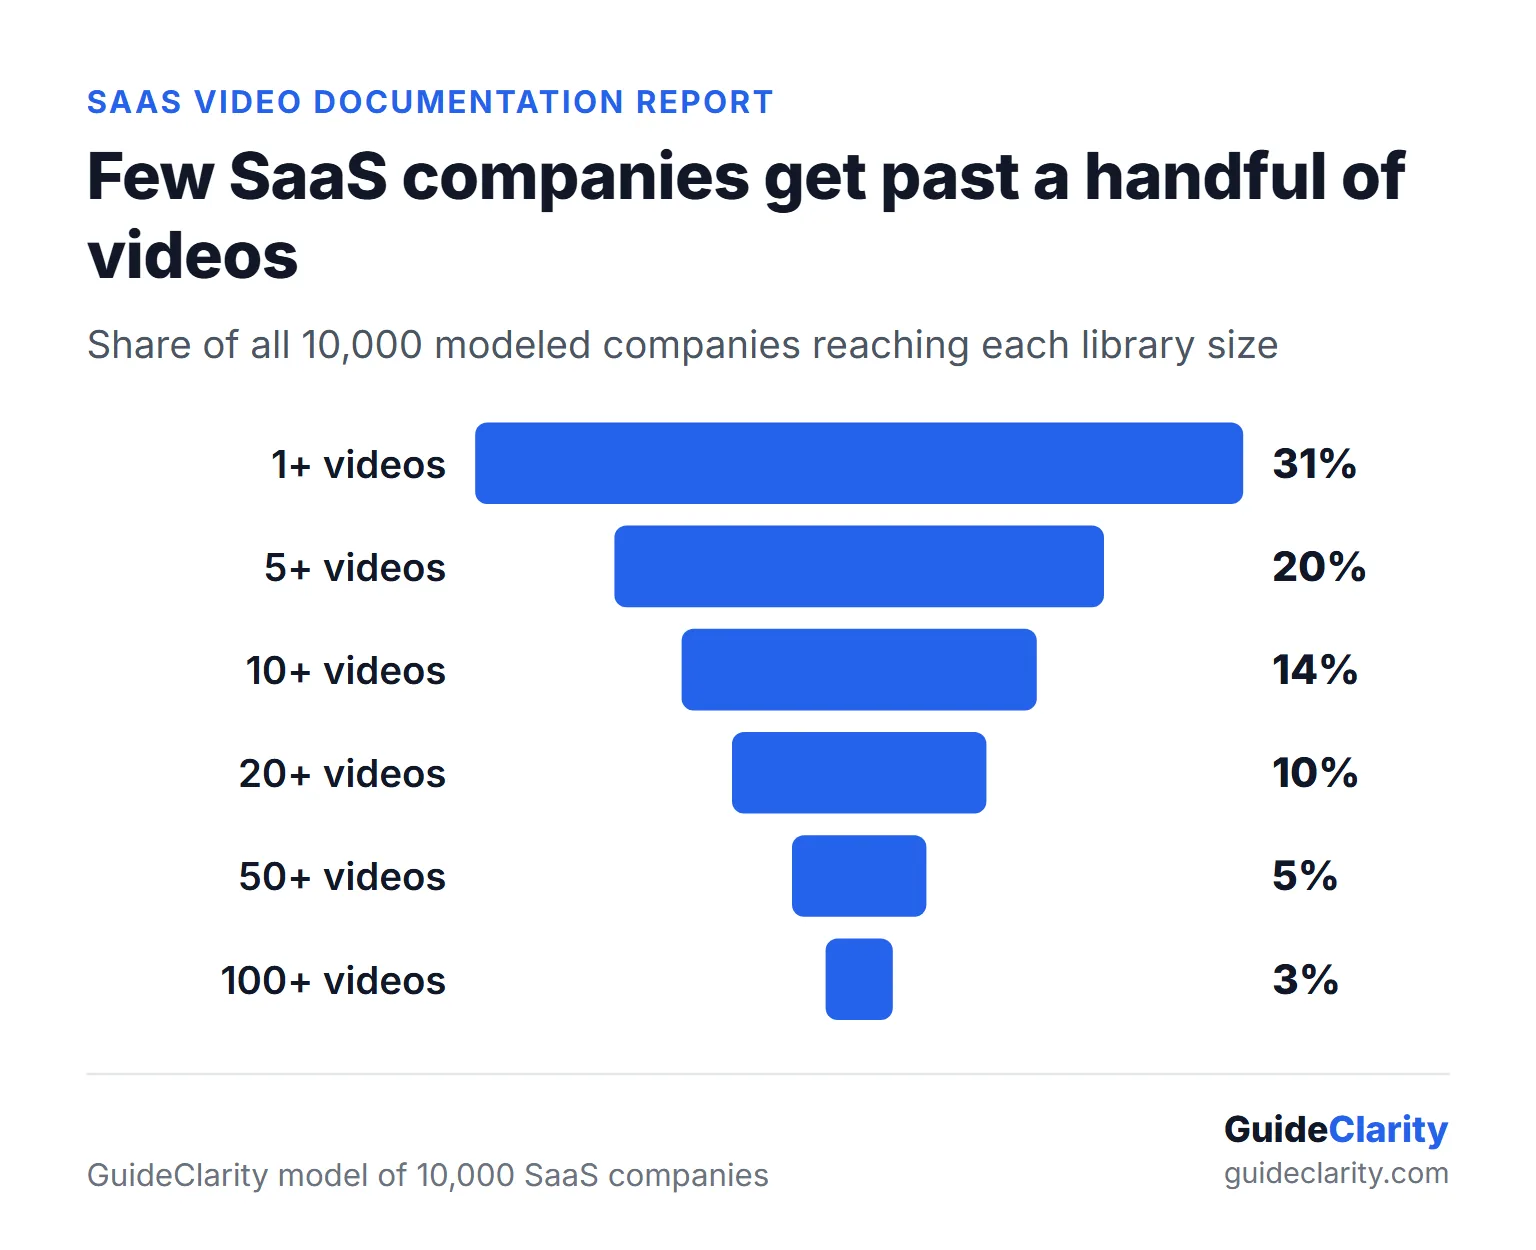
Video documentation is still rare in SaaS help centers, even though most businesses already use video. These figures come from a modeled market scenario of 10,000 SaaS companies, not from a crawl of real help centers. The model estimates that about 31 percent of SaaS companies publish at least one user-facing video. Only about 9 percent run a structured video library.
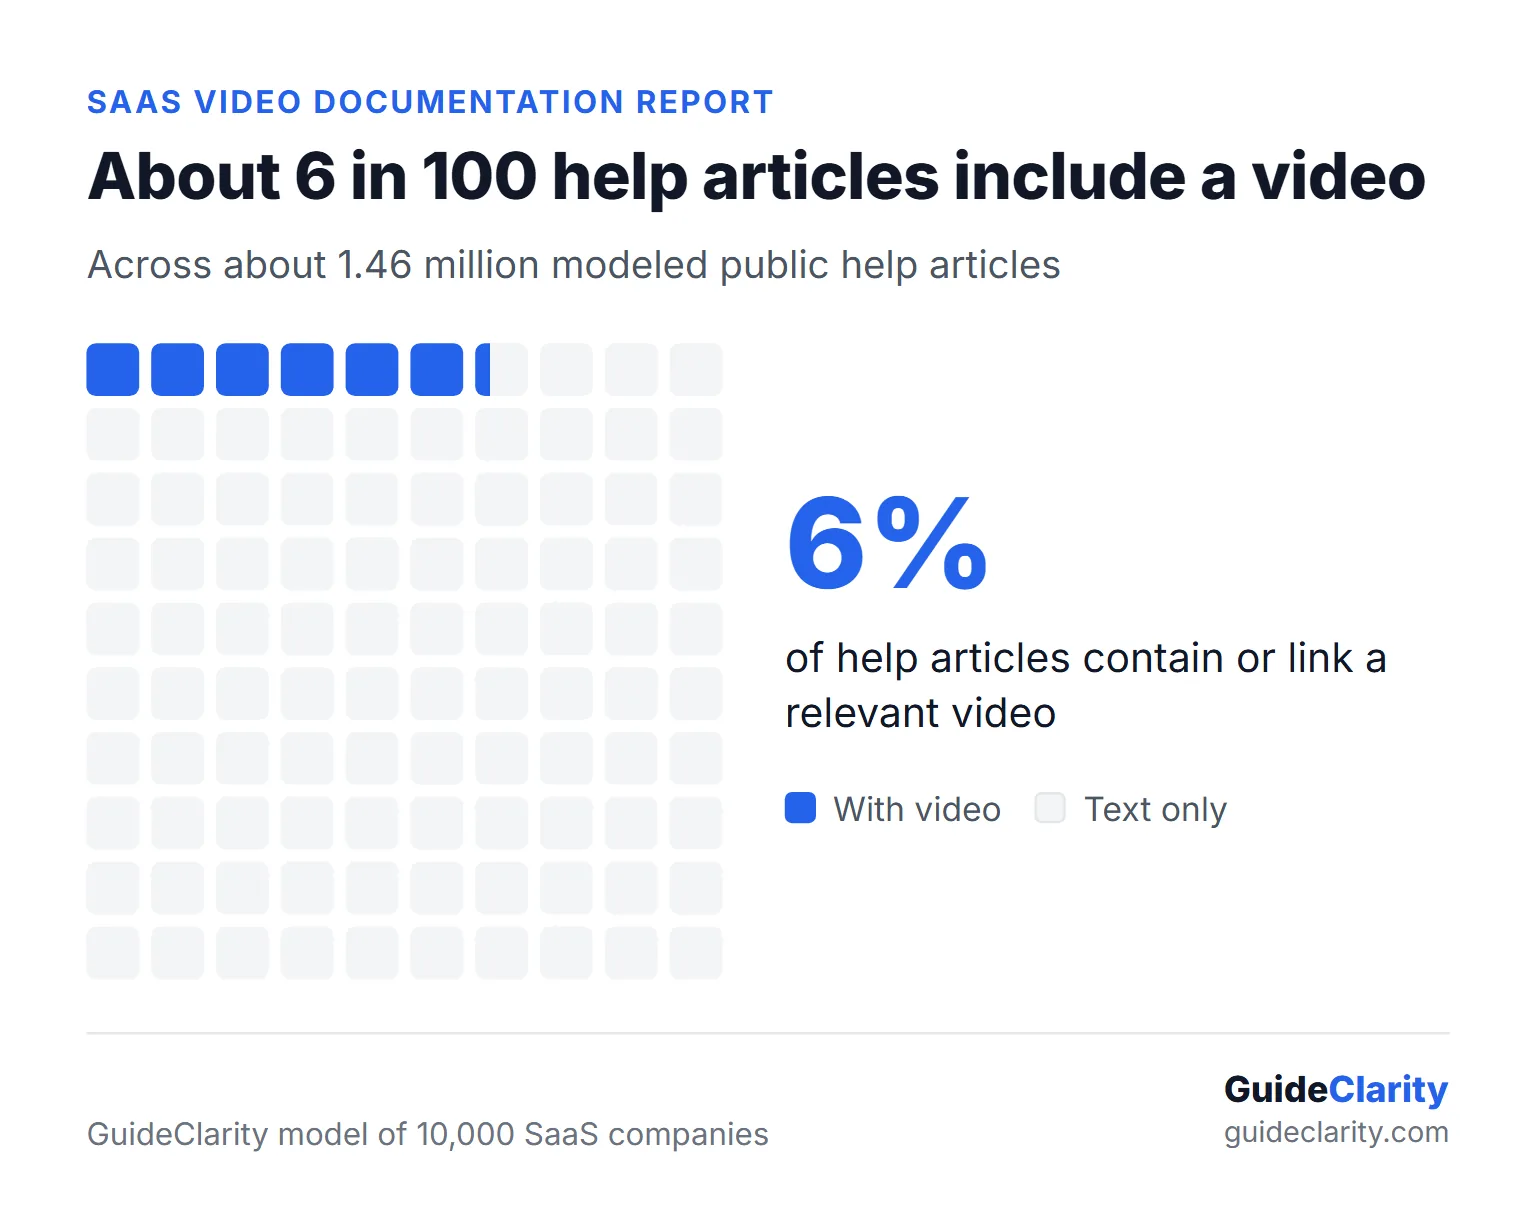
- About 6 percent of about 1.46 million modeled public help articles include a video. About 94 percent are text only.
- Larger companies use far more video. Adoption runs from about 17 percent at the smallest companies to about 58 percent at the largest.
- About 35 percent of dated video-covered articles changed at least 90 days after their video was made.
Key findings from the SaaS video documentation model
The SaaS video documentation model points to one pattern. Companies make videos, but they do not run video documentation. The findings below are the model's estimates, rounded in the text. The charts and data tables use the same whole numbers, because a model cannot support more precision. Each finding is written so it can be quoted on its own, with its base.
- About 31 percent of SaaS companies publish at least one user-facing video, according to the model.
- Only about 9 percent of SaaS companies run a structured video library.
- About 6 percent of about 1.46 million modeled public help articles include a relevant video.
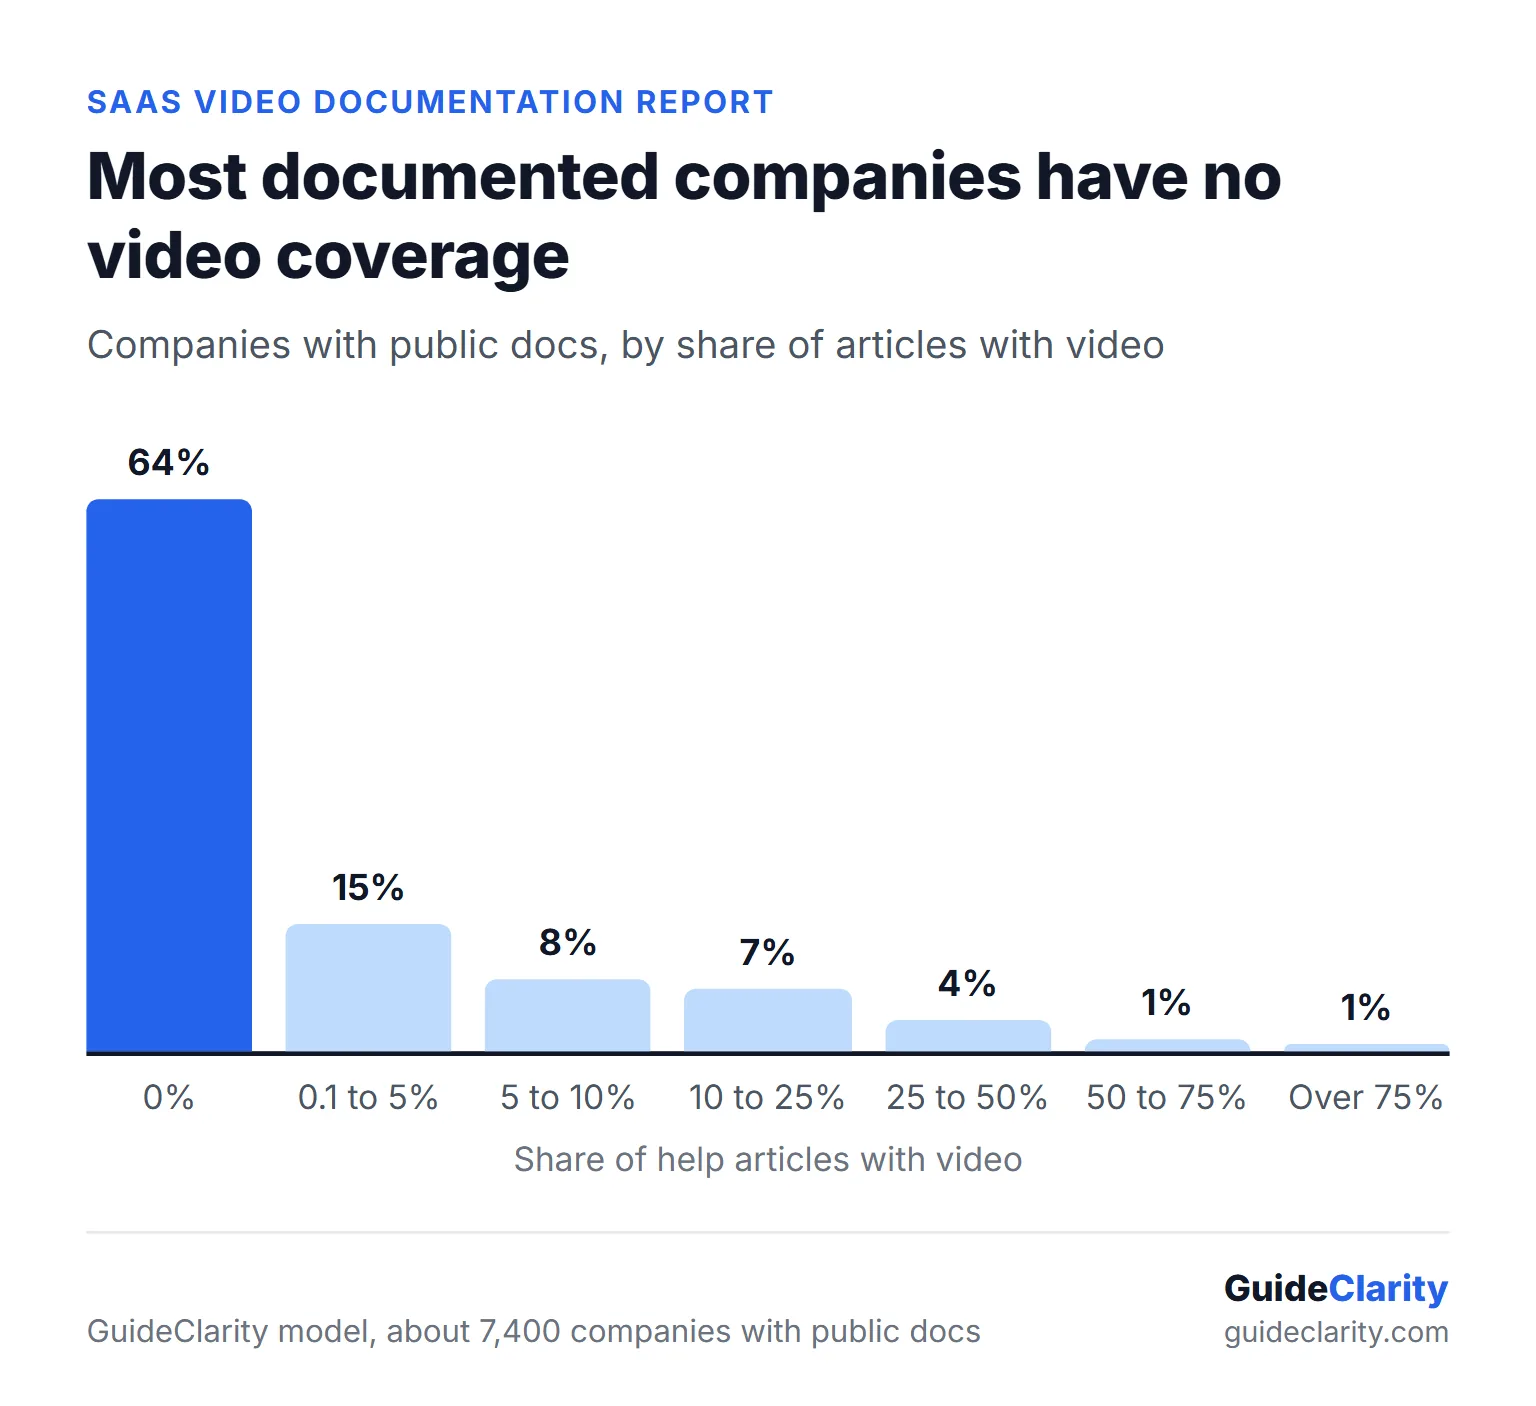
- About 64 percent of SaaS companies with public docs have no video in any help article.
- Only about 6 percent of companies with public docs put video on a quarter or more of their articles.
- Video adoption rises from about 17 percent at 1 to 10 employees to about 58 percent at the largest companies.
- Feature how-to and onboarding videos make up about 54 percent of all modeled help videos.
- About 35 percent of dated video-covered help articles were updated at least 90 days after their video.
What is video documentation in SaaS?
Video documentation is product help delivered as video. In SaaS, it means videos that teach existing users how to use the product. Typical examples are getting started videos, feature walkthroughs, workflow tutorials, integration setup guides and troubleshooting clips. A video counts when it lives in the help center, an academy, an in-app panel or a tutorial channel that customers use.
This report uses a strict definition. It leaves out advertising, brand films, testimonials, founder interviews, podcasts, generic webinars and pure sales demos. They may be good content, but they do not help a customer finish a task inside the product.
This report tracks interactive demos as a separate, adjacent category. A clickable product tour can teach a workflow, but it is not a video. Mixing the two would inflate the numbers. The interactive demo tools comparison covers that category in depth.
Why video documentation matters for SaaS teams now
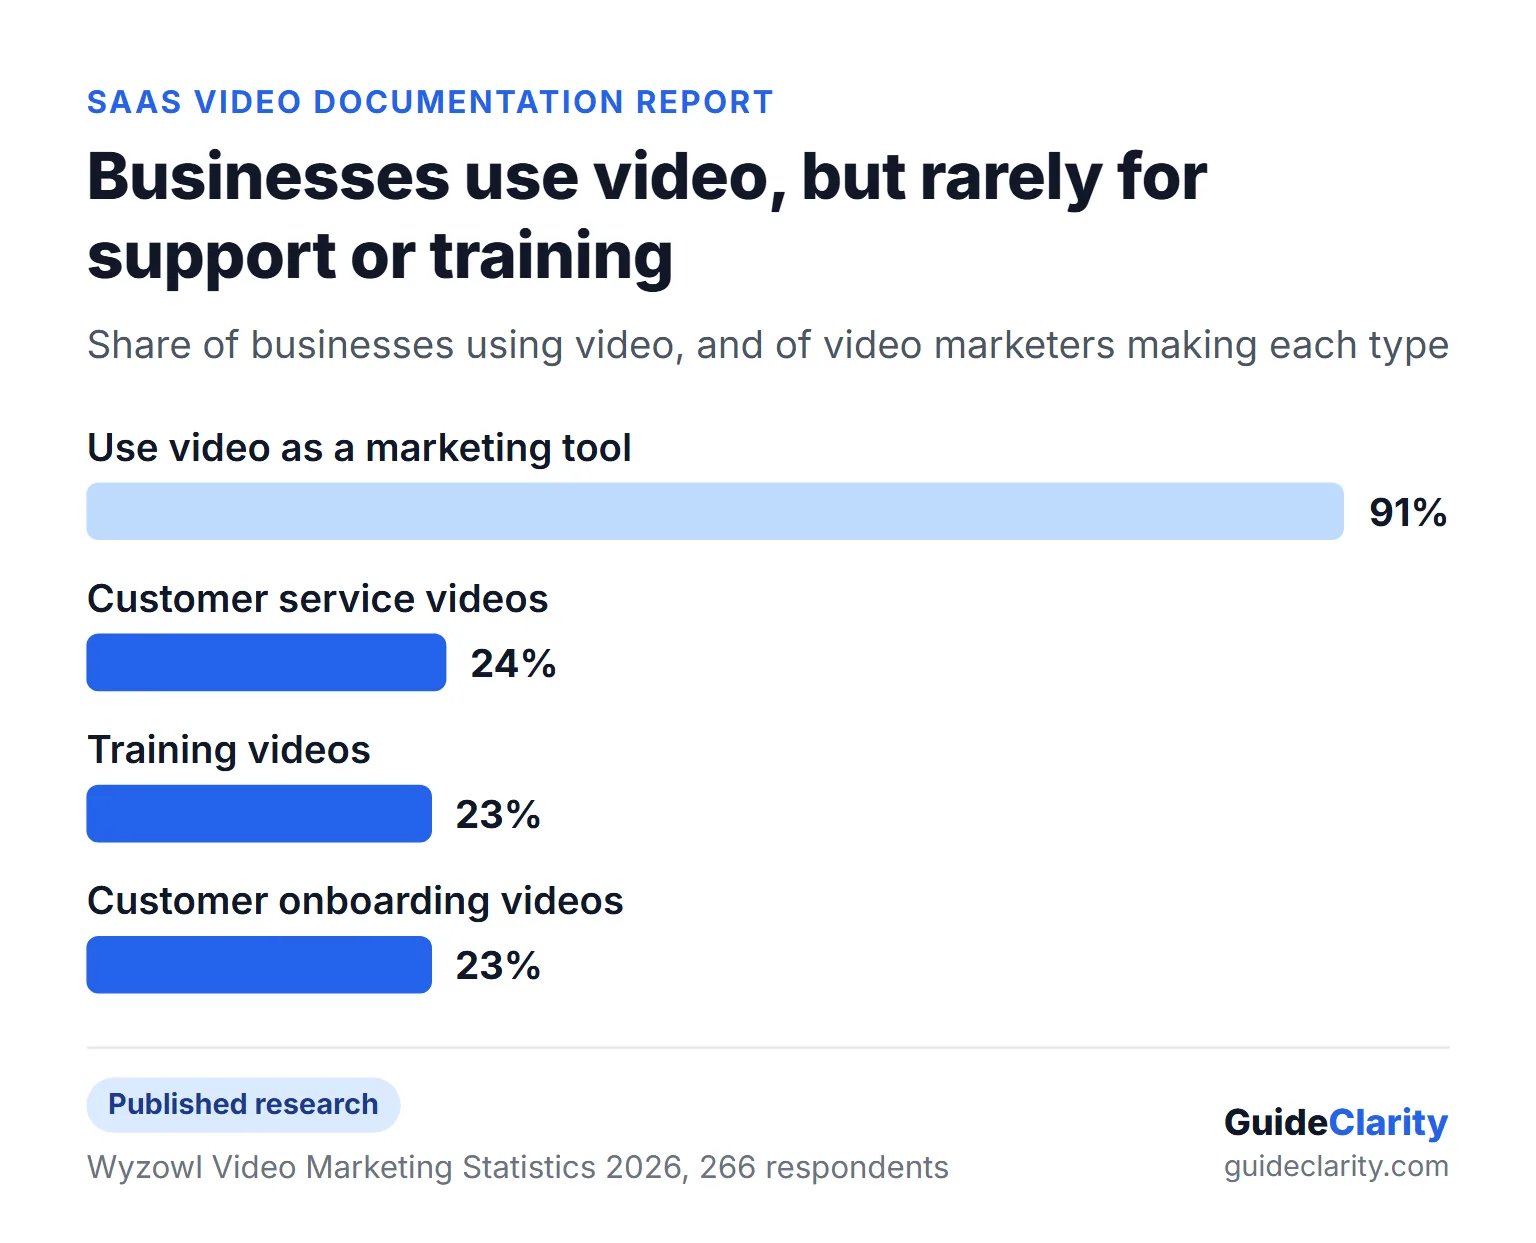
Video documentation matters because customers already prefer video, while most SaaS help content is still written. Published survey data shows the gap clearly. In its 2026 survey, Wyzowl reports that 91% of businesses use video as a marketing tool. Yet only 24% of video marketers make customer service videos, and 23% make training videos.
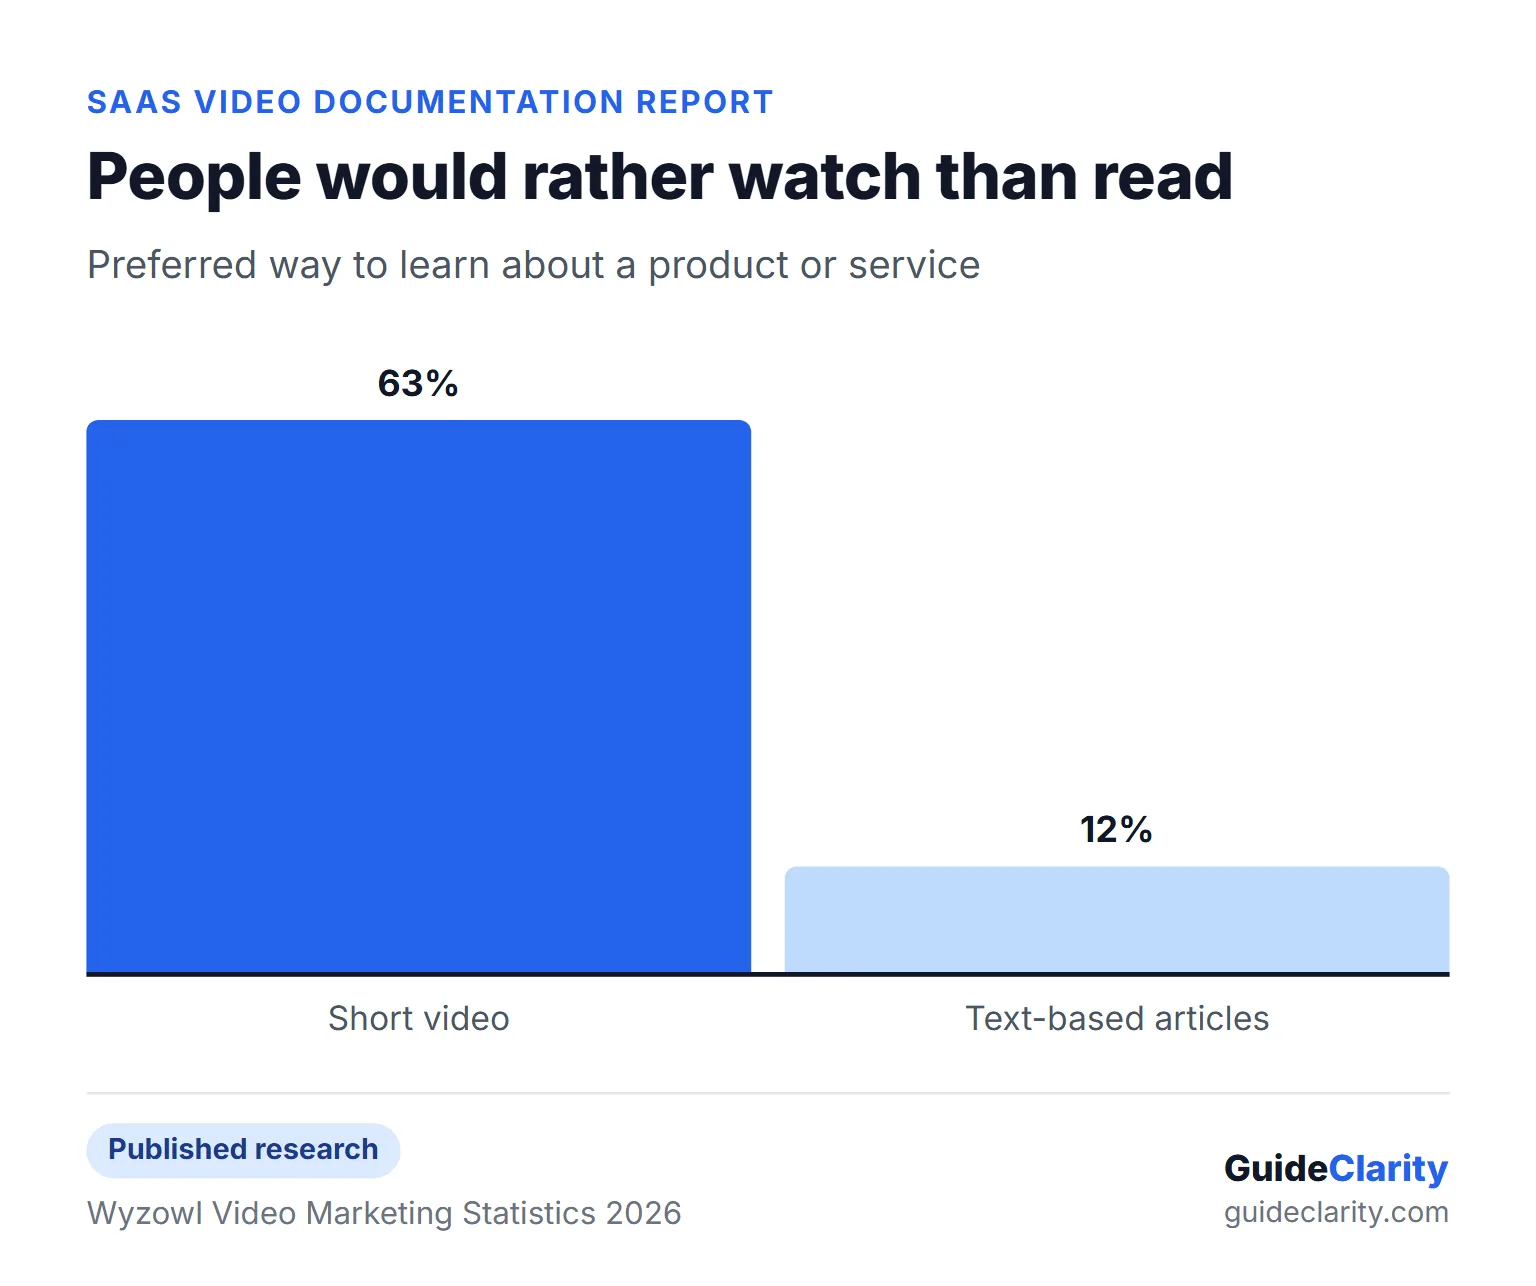
The same Wyzowl 2026 survey asked people how they would most like to learn about a product. 63% chose a short video. Only 12% chose text-based articles. Help centers are built the other way round, with text first and video as an extra.
Customer education leaders see a similar gap between having content and running a system. In the State of Customer Education 2026, Absorb Software reports that 51% of programs call themselves mature, but only 19% pass a real maturity test. That distinction, content versus system, is the lens for the rest of this report.
How many SaaS companies publish help videos?
The model estimates that about 31 percent of SaaS companies publish at least one user-facing video. That is far below the 91% of businesses that use video for marketing. The share falls fast as the bar rises. About 20 percent reach five videos, about 14 percent reach ten, and about 3 percent reach one hundred.
Public documentation itself is common. The model puts about 74 percent of SaaS companies with a public help center or docs site. So the missing piece is not documentation. It is video inside that documentation.
About 69 percent of modeled companies have no public user video at all. Some of them may host videos behind a login or inside the product. That is why this report says "publicly detectable" when it describes absence.
How big are SaaS video libraries?
Most SaaS video libraries are small. Among the roughly 3,100 modeled companies with any user video, about 37 percent have only 1 to 4 videos. The median library holds about 7 videos. The mean is about 29, because a small group of companies runs large libraries that pull the average up.
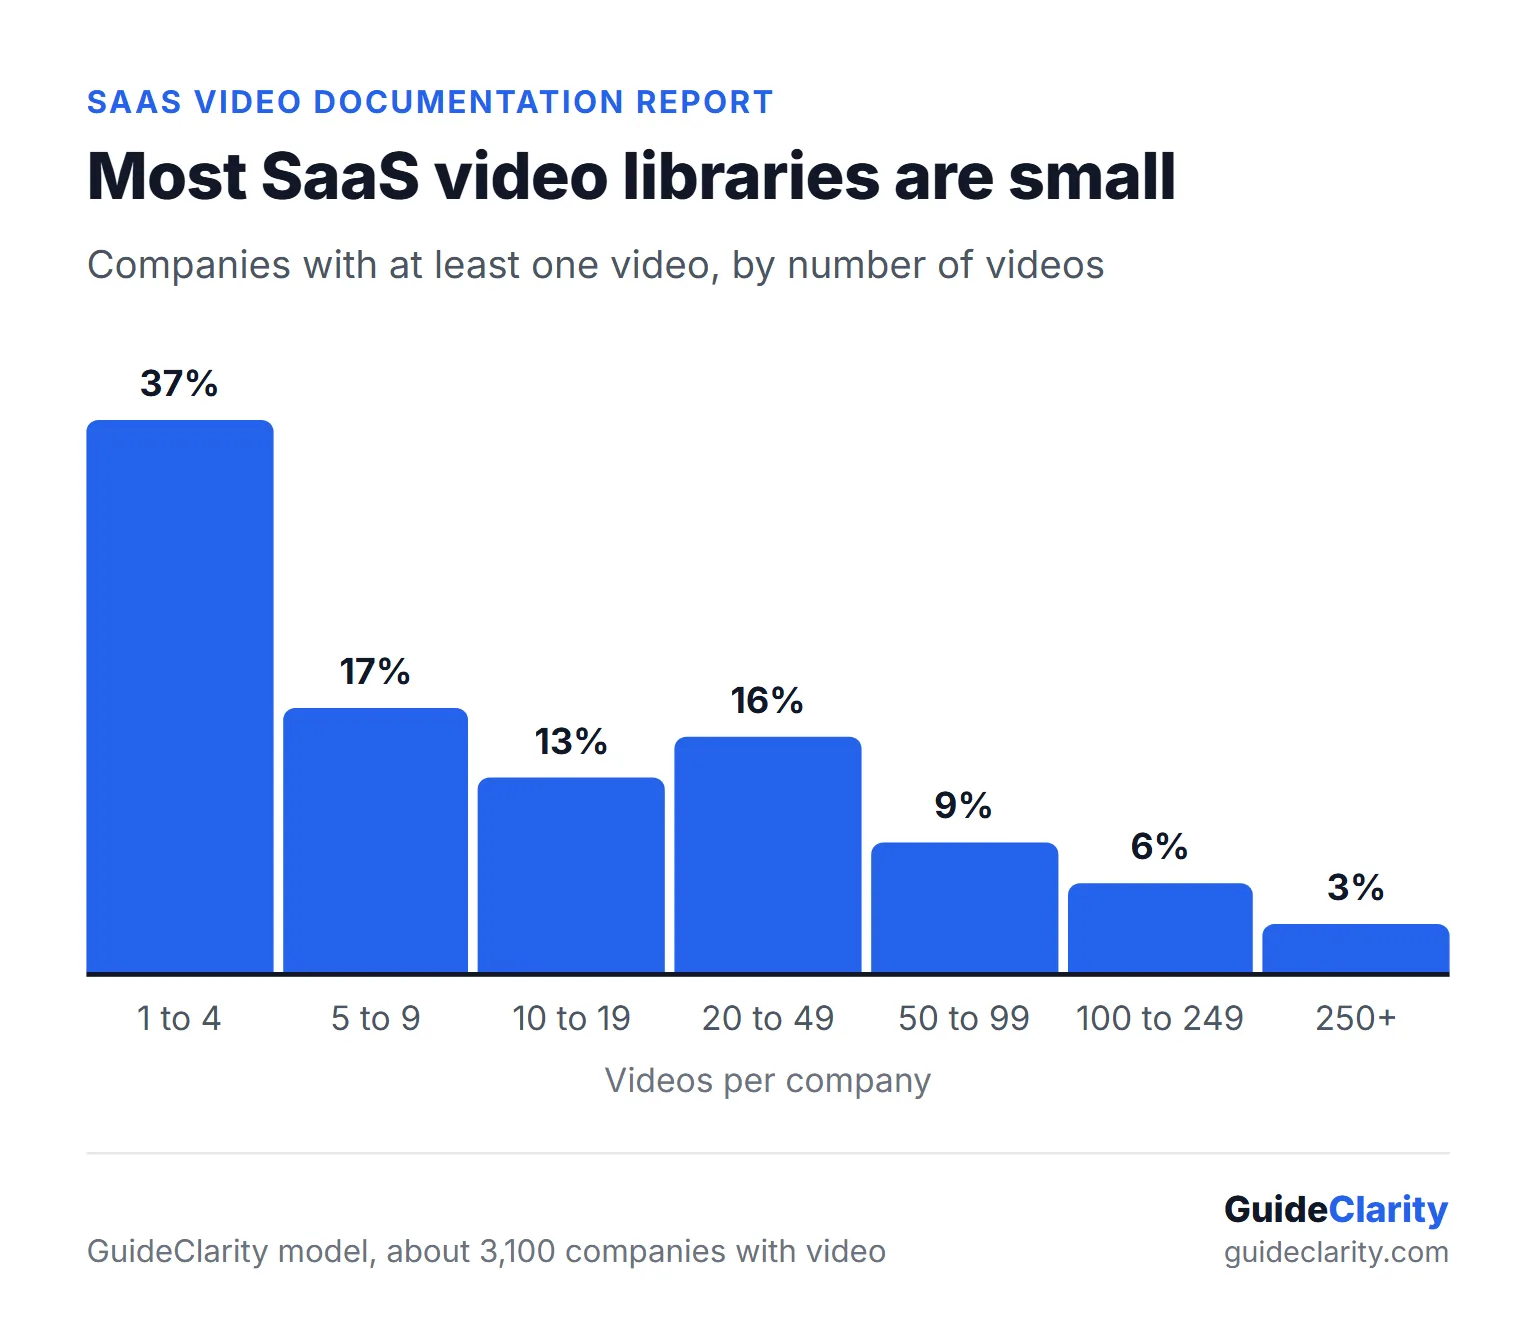
This right-skewed shape is typical of an early market. A few leaders invest heavily, while most companies make a handful of videos for their most important workflows and stop there. About 3 percent of companies with video run libraries of 250 videos or more.
For a SaaS team, this is good news. A library of 25 well-chosen videos already puts a company in the top quarter of the modeled market.
Does company size change video adoption?
Company size changes video adoption a lot. The model estimates that about 17 percent of SaaS companies with 1 to 10 employees publish a user video. At companies with more than a thousand employees, about 58 percent do. Structured libraries follow the same curve, from about 2 percent at the smallest companies to about 28 percent at the largest.
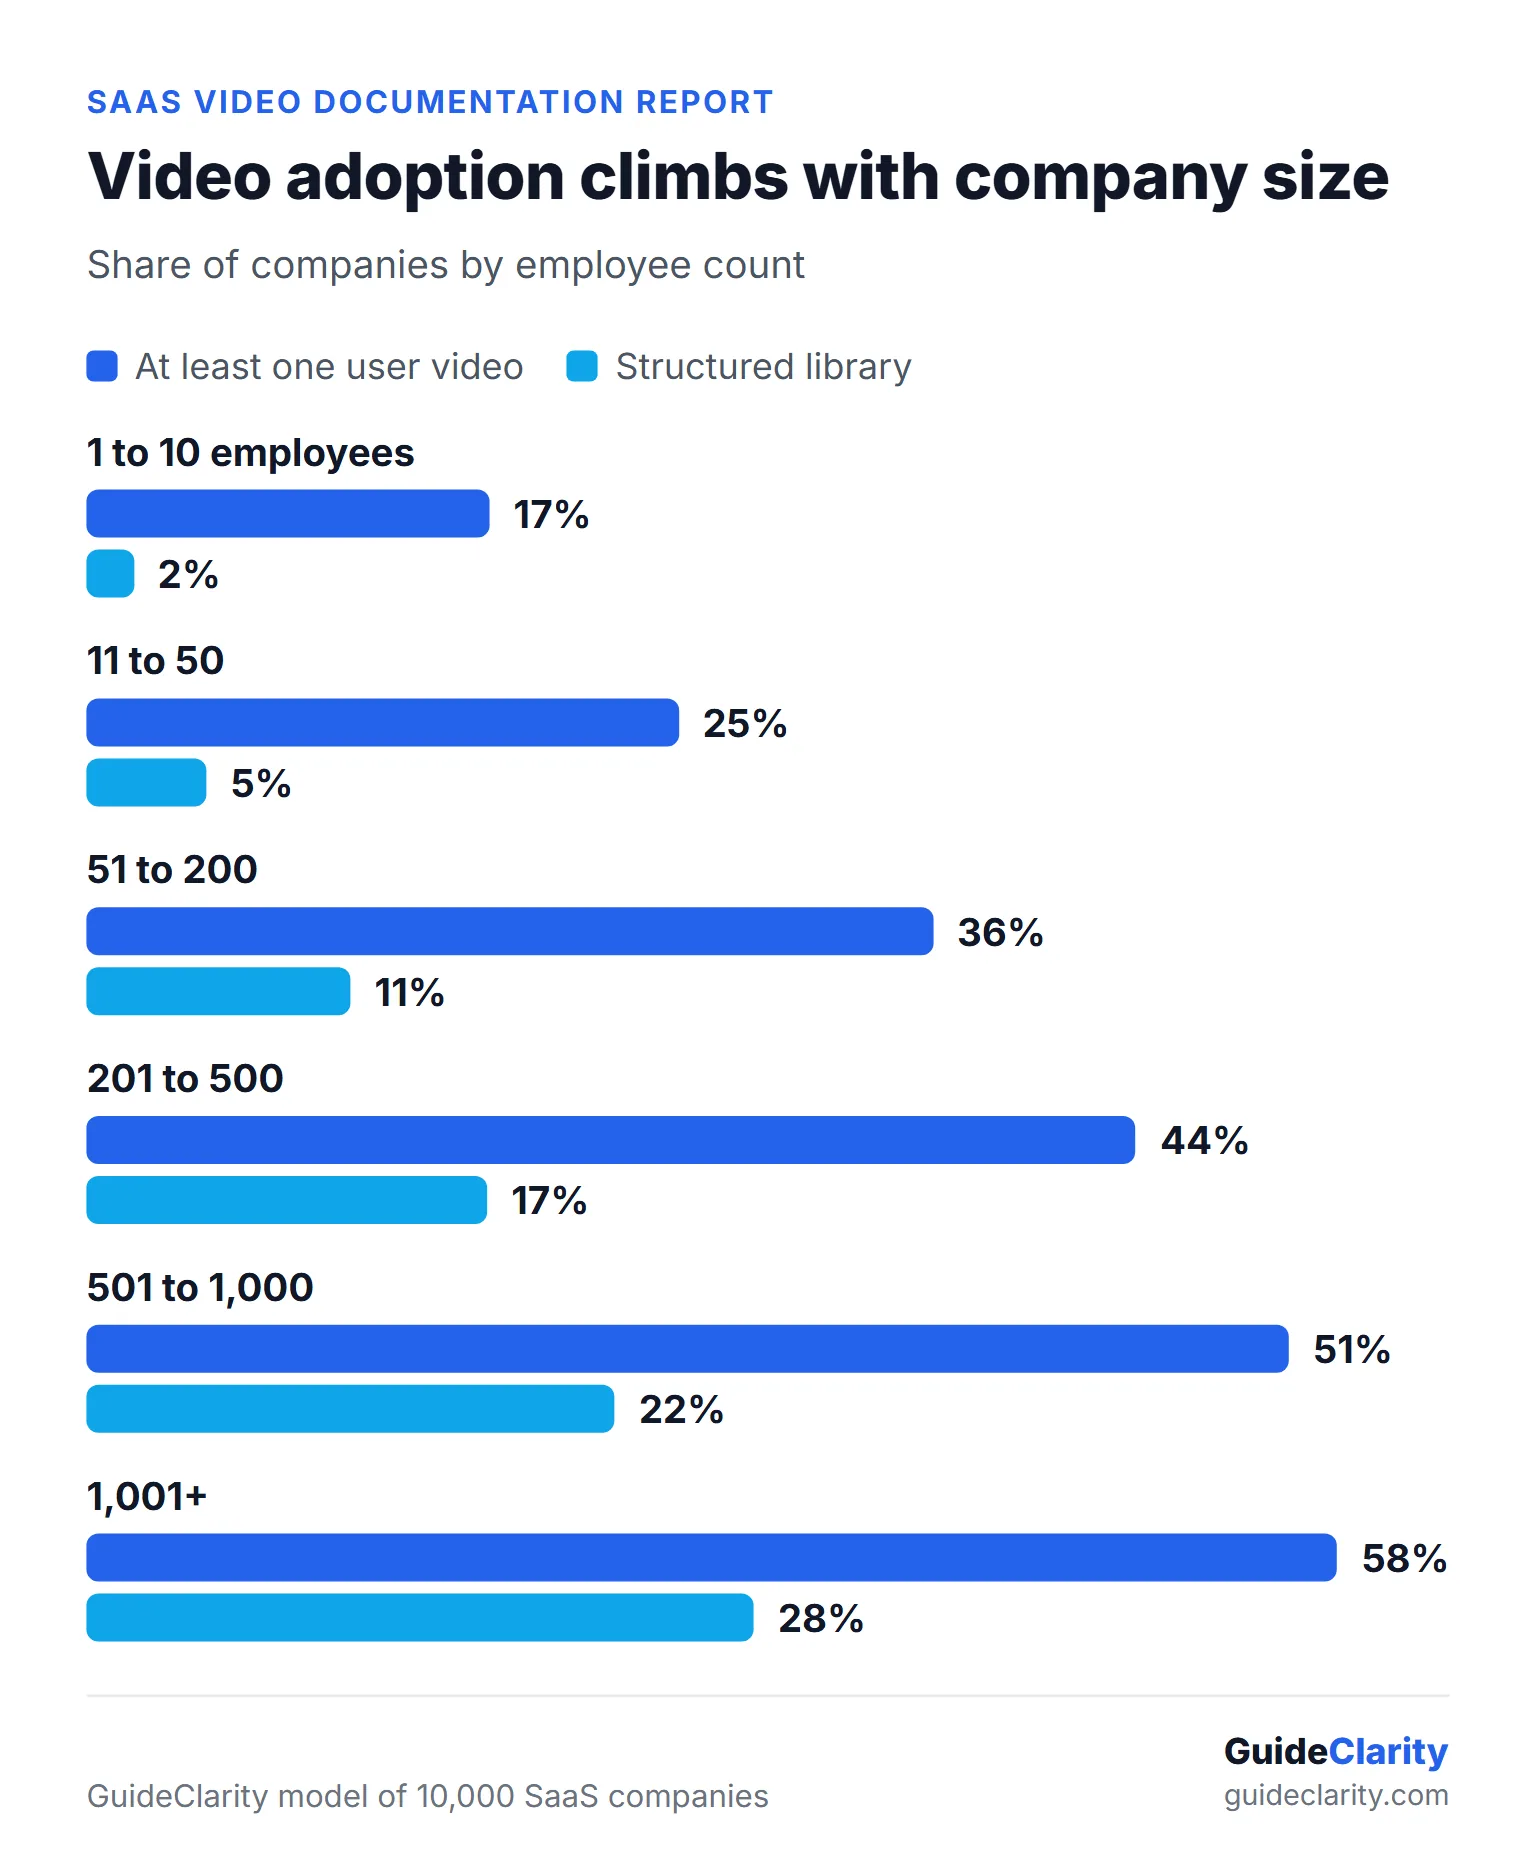
The clearest step appears at 51 to 200 employees. At that size, about 36 percent of SaaS companies publish video and about 11 percent run a structured library. This is roughly when companies hire dedicated support, customer success, documentation and product marketing roles.
Smaller teams are not short on reasons to use video. They are short on hours. Recording, editing and re-recording compete with shipping the product itself, which is why the gap is widest at the smallest companies.
How much SaaS documentation includes video?
Little SaaS documentation includes video. The model counts about 1.46 million qualifying public help articles across 10,000 companies. Only about 92,000 of them contain or directly link a relevant video. That is about 6 percent coverage, which leaves about 94 percent of help articles as text only.
Coverage is uneven between companies too. Among the roughly 7,400 modeled companies with public docs, about 64 percent have no video in any help article. Only about 440 companies, about 6 percent of those with docs, put video on a quarter or more of their articles.
The model puts the ratio at one video-covered article for about every 16 help articles. Not every article needs a video. But if only 20% of the roughly 1.37 million text-only articles were good video candidates, that would still mean about 274,000 potential guides. At 30% suitability the number is about 412,000, and at 40% it is about 549,000.
What do SaaS companies make help videos about?
SaaS companies make help videos mostly about features and onboarding. In the model, feature how-to videos are about 32 percent of all help videos and getting started videos are about 22 percent. Together they make up about 54 percent. Troubleshooting, FAQ and advanced training each hold a small share.
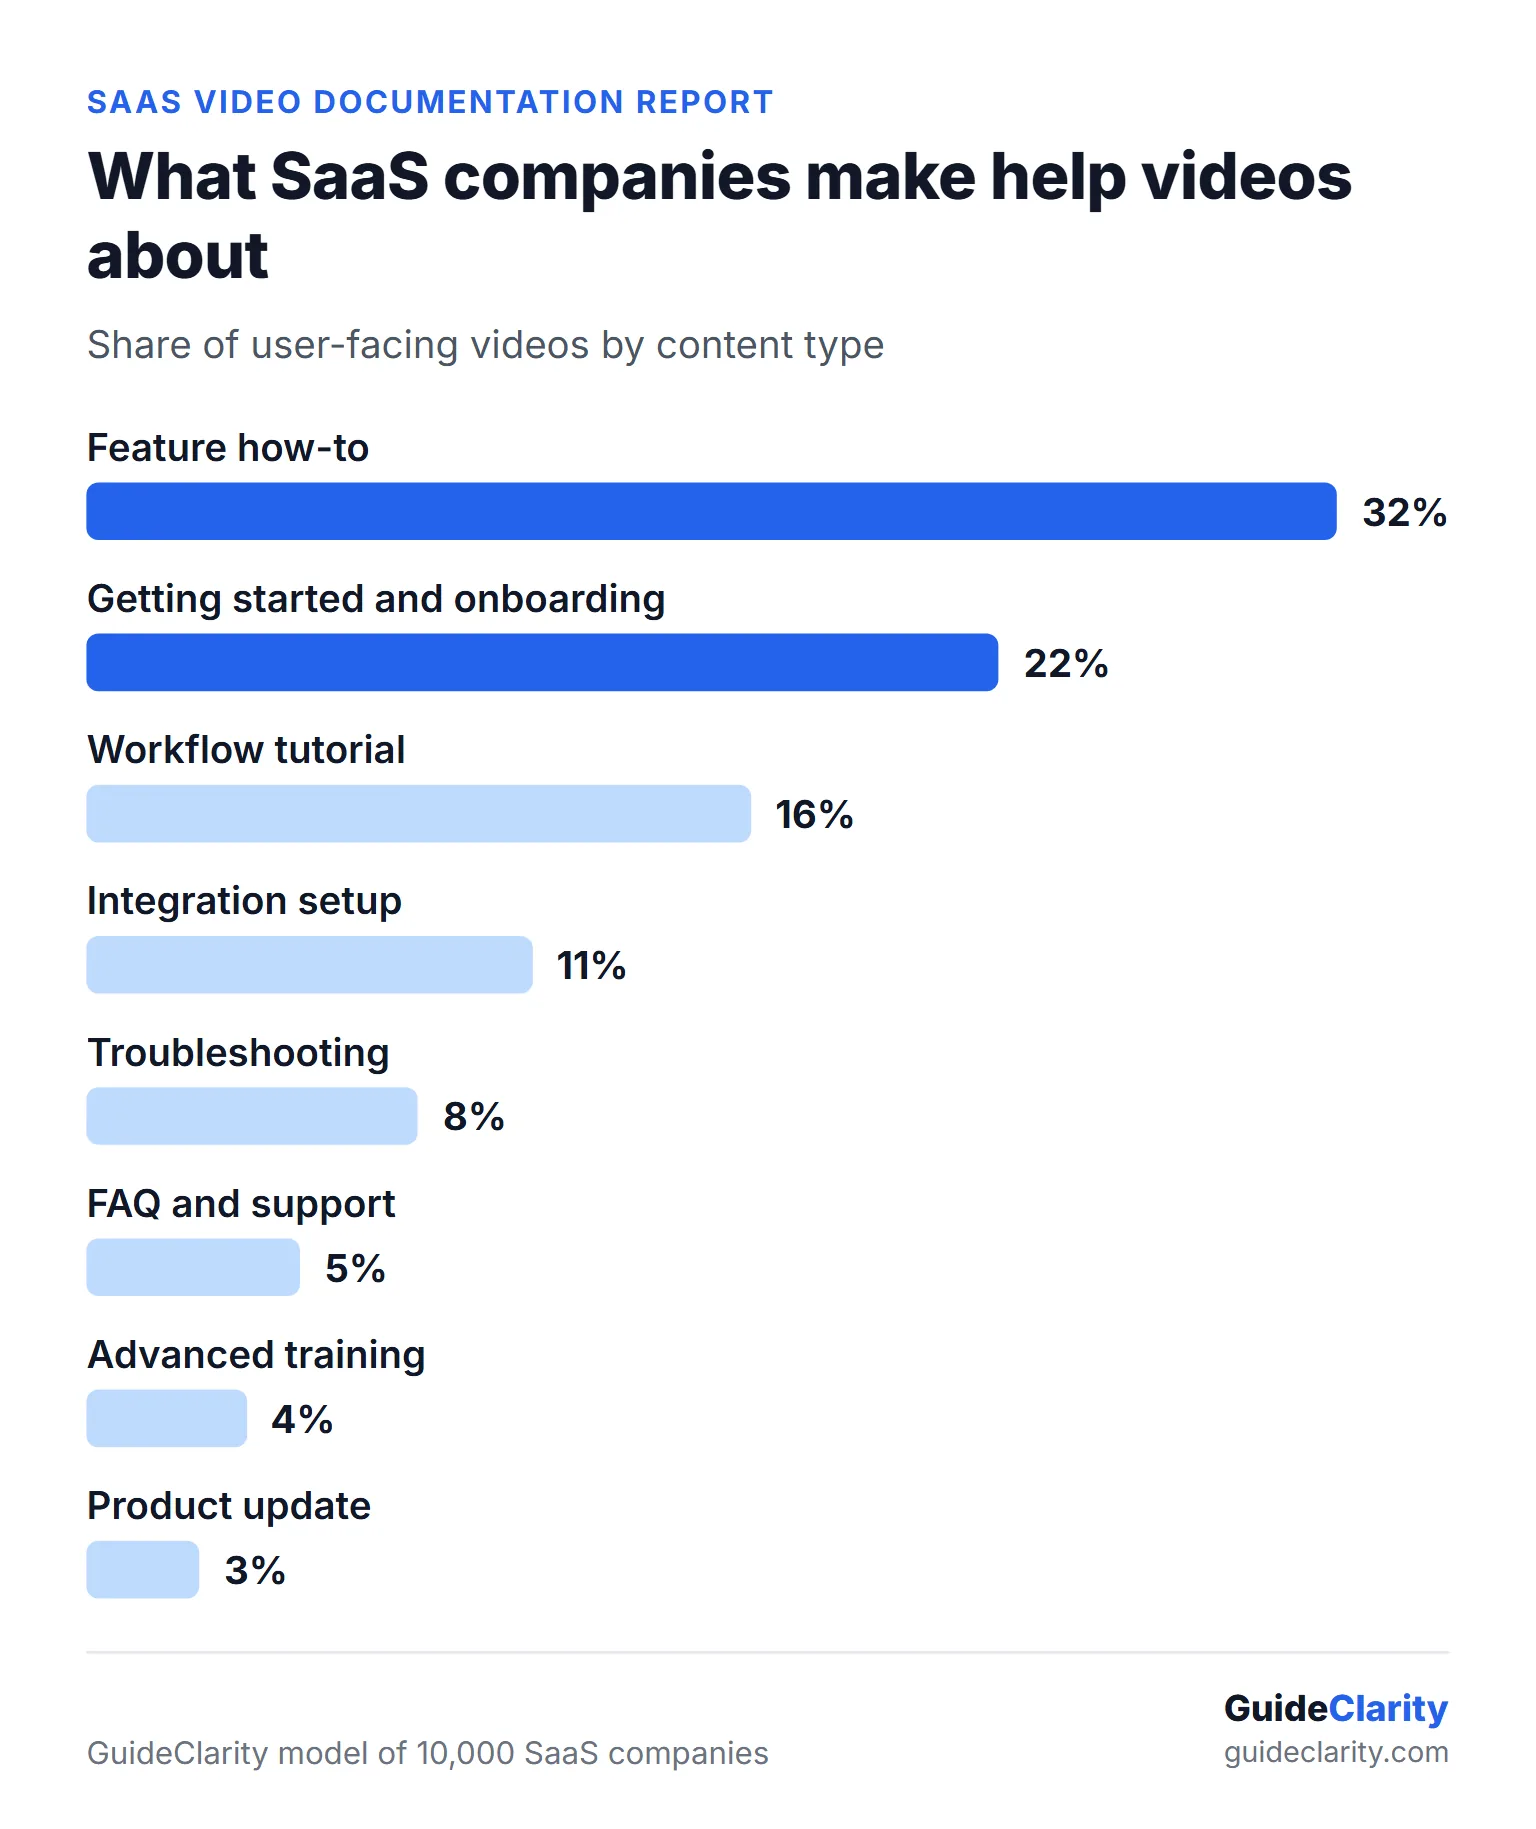
This pattern makes sense. Teams record video where the payoff is highest and the workflow is most visual. The long tail of documentation, such as settings, permissions and edge cases, stays in text.
The format is mostly simple. The model estimates that about 52 percent of help videos are screen recordings with narration. Clearly synthetic or AI avatar videos are about 3 percent, even though AI explainer videos get a lot of attention. That matches the direction in the Wyzowl 2026 data, where 19% of video marketers mostly create screen-recorded video. For a deeper look at the onboarding slice, see the SaaS onboarding video playbook.
Where SaaS companies host help videos
SaaS companies host most help videos on YouTube. The model estimates YouTube carries about 49 percent of user-facing help videos. Vimeo holds about 14 percent and Loom about 10 percent. Dedicated tutorial platforms and interactive demo platforms each hold a smaller share.
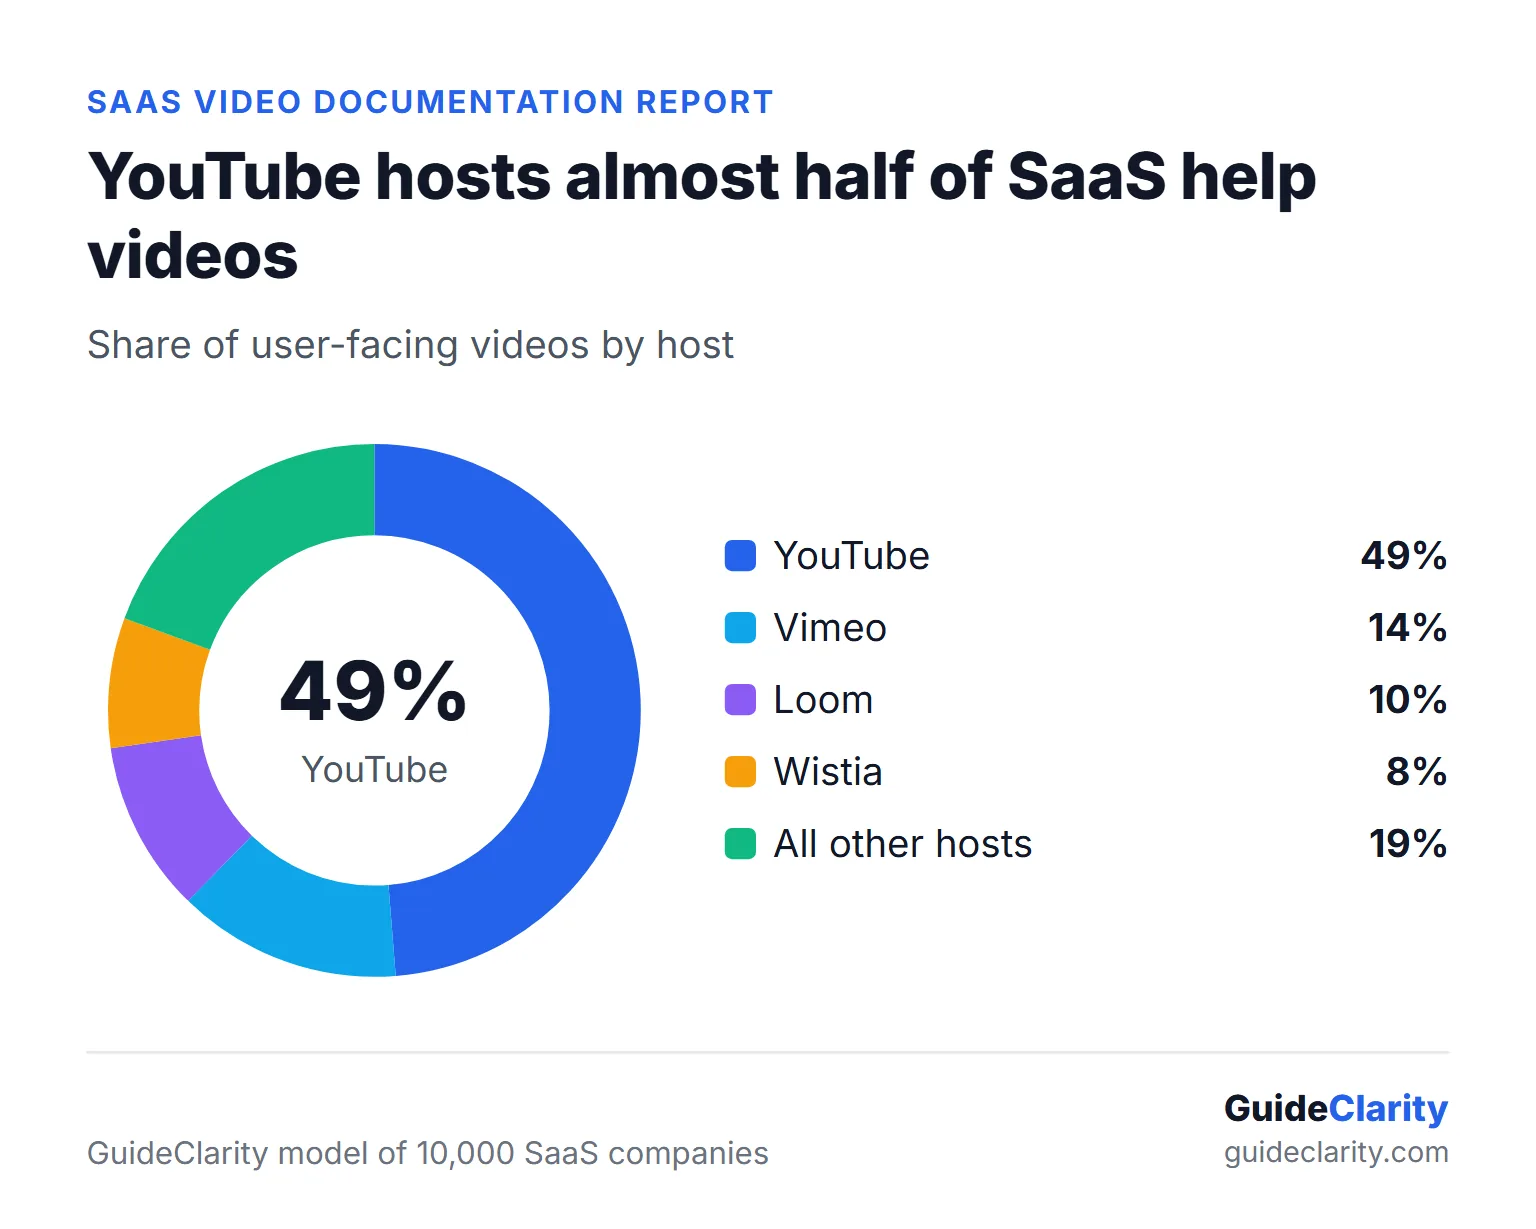
Hosting and placement are different questions. Among SaaS companies with video, the model estimates about 62 percent show it in the help center and about 55 percent on YouTube. About 18 percent place video inside the product, and about 35 percent use several channels at once.
The dominant pattern is still a written help article with a video embedded in it. A fully video-first knowledge base is rare. Public hosting is cheap and easy, which also explains why Wyzowl finds that 82% of businesses upload their videos to YouTube.
The video documentation freshness gap
The video documentation freshness gap is the time between a help article's last update and the date of its video. A large gap suggests the product changed but the video did not. The model looks at about 68,000 video-covered articles with reliable dates. In about 35 percent of them, the article was updated at least 90 days after the video was made.
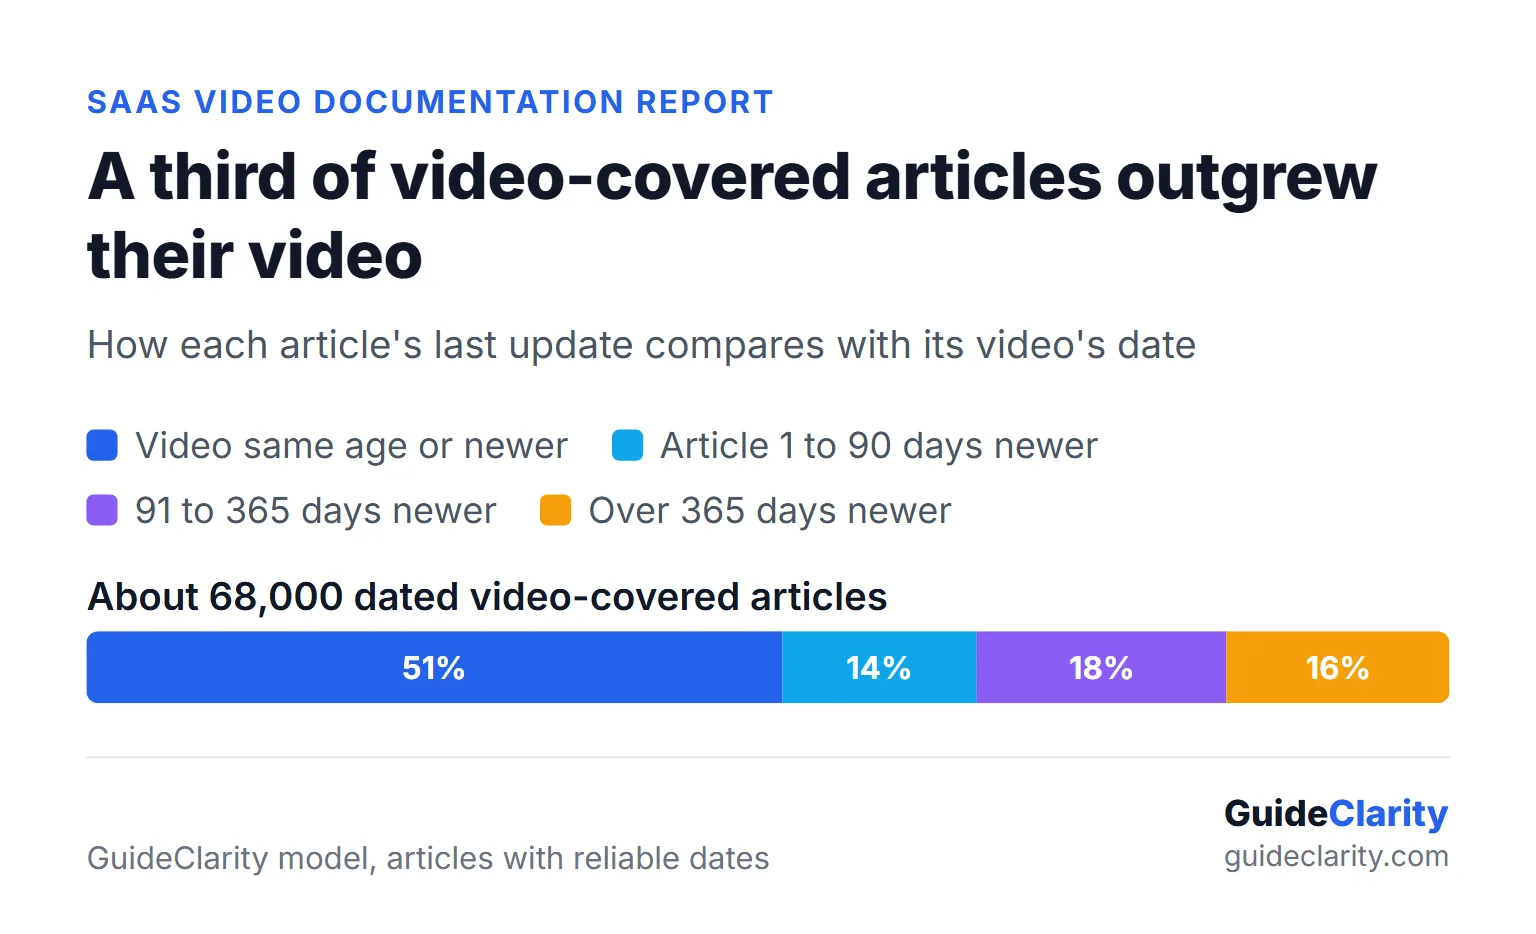
That is about 24,000 articles in the model. In about 16 percent of dated articles, the gap is longer than a year. In about 51 percent, the video is as new as the article or newer.
A gap is a warning sign, not proof of an error. An article may change for a typo while the video stays correct. But SaaS interfaces change often. A new menu label or a moved button can make a video wrong. Fixing text takes minutes. Fixing a video usually means recording, editing, narrating, captioning and uploading again. That maintenance cost is a big reason video stays selective.
The video documentation maturity model
The video documentation maturity model sorts SaaS companies into six levels, from no video to video-first. In the model, about 69 percent of SaaS companies sit at level None. About 11 percent are Experimental, about 10 percent are Developing, and about 6 percent are Structured. Advanced and Video-first together hold about 3 percent.
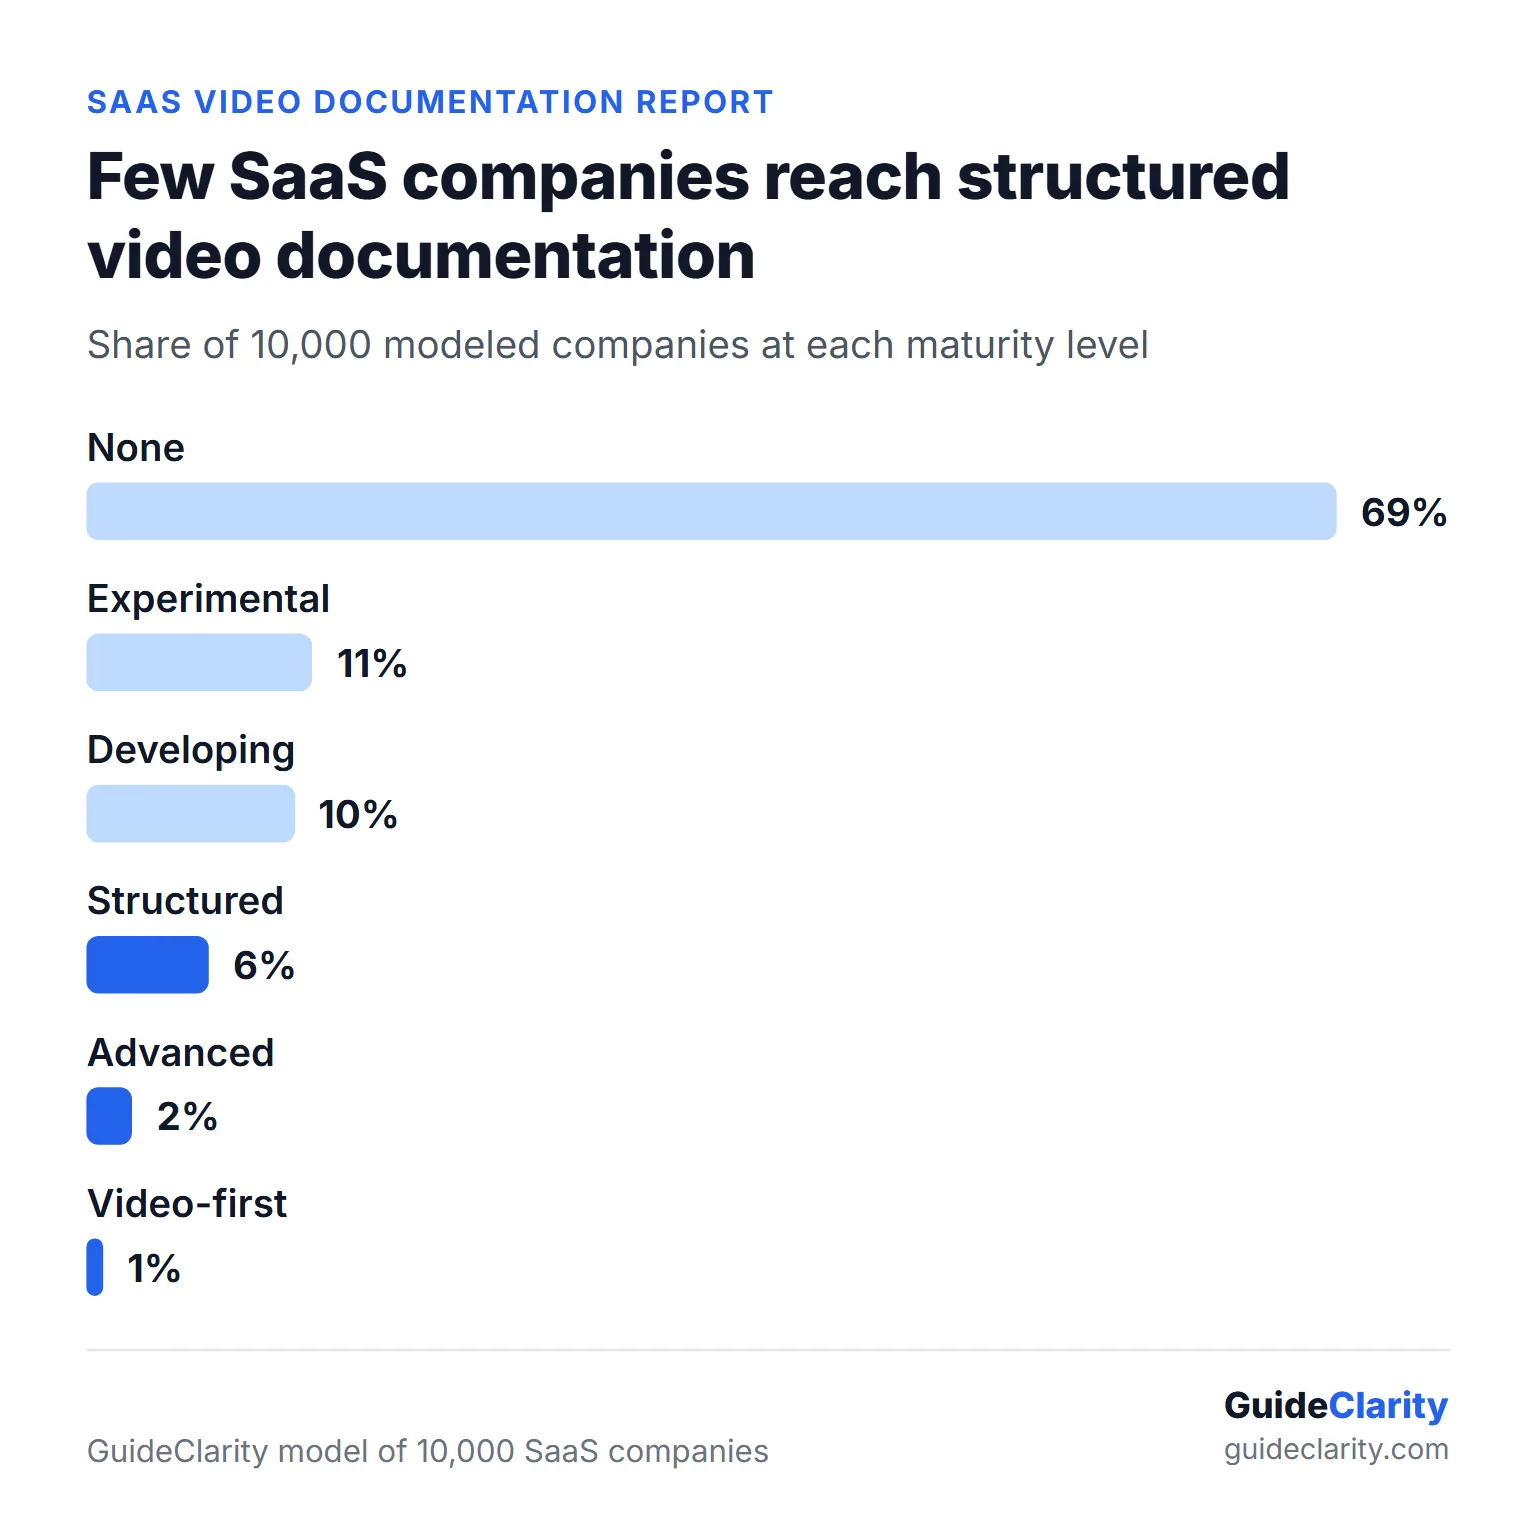
| Level | What it looks like | Modeled share |
|---|---|---|
| None | No public user video | 69% |
| Experimental | A few isolated tutorials | 11% |
| Developing | Videos for key workflows, no system | 10% |
| Structured | An organized library tied to the docs | 6% |
| Advanced | Broad coverage with regular updates | 2% |
| Video-first | Video is the default help format | 1% |
To make the levels measurable, this report proposes a Video Documentation Maturity Index. It scores a company out of 100 points. Documentation coverage carries the most weight, followed by freshness and library depth.
| Index component | Points |
|---|---|
| Documentation coverage | 25 |
| Freshness | 20 |
| Library depth | 15 |
| Adoption | 10 |
| Organization | 10 |
| Accessibility | 5 |
| Localization | 5 |
| Distribution | 5 |
| Production continuity | 5 |
What the data means for SaaS documentation teams
For SaaS documentation teams, the model suggests a clear opportunity. Most competitors have little or no video in their help centers, so even modest video coverage stands out. The hard part is not the first video. It is keeping a growing library correct as the product changes. These steps follow from the findings.
- Start with the 20 articles that get the most traffic and describe the most visual workflows. Feature how-to and onboarding topics are where most teams begin.
- Measure video coverage as a share of help articles, not as a count of videos. Coverage is the number that shows progress.
- Track a freshness gap for every video. Flag any video that is 90 days older than its article and review it.
- Pair every video with written steps. Text stays searchable and easy to scan, and the video shows the clicks.
- Plan for updates before you scale. Decide how a video gets replaced when the interface changes, before you have hundreds of them.
The update problem is where tooling now matters most. A recording-based workflow can turn one capture into several assets, as the content repurposing workflow shows. GuideClarity takes this further for product releases. It learns each shipped feature and produces a walkthrough video on the same day. A new video can then follow each product change instead of lagging behind it.
How this SaaS video documentation report was made
The SaaS video documentation report is a modeled market scenario, not a measurement. It is a research design for a future crawl. It sets out expected values for 10,000 SaaS companies in six size bands. Its values aim to fit published benchmarks, mainly the Wyzowl 2026 survey of 266 respondents and the State of Customer Education 2026 from Absorb Software and Lighthouse Research and Advisory.
The benchmarks inform the scenario, but they do not determine any single figure. No published source gives these exact numbers, and this report does not include model code or company-level records. Read each figure as an informed estimate of what a crawl would likely find.
| Employees | Share of modeled companies |
|---|---|
| 1 to 10 | 21% |
| 11 to 50 | 32% |
| 51 to 200 | 25% |
| 201 to 500 | 11% |
| 501 to 1,000 | 6% |
| 1,001+ | 5% |
Each headline metric has a plain definition. Adoption means at least one public user-facing video. Coverage means the share of qualifying help articles that contain or link a relevant video. The freshness gap is the time between an article's last update and the date of its video. Maturity levels combine library size, coverage and organization.
Two adjustments keep the report consistent. This edition rescales the size-band rates so their weighted average matches the headline totals, because the scenario's original size table pointed slightly higher. All modeled figures are rounded to whole numbers, since a model cannot support more precision.
The model treats interactive demos separately. It gives a plausible range of 12 to 16 percent for interactive guides. Detectable AI-generated guides fall in a range of 4 to 10 percent. Those ranges are rougher than the core estimates.
GuideClarity sells software that turns product releases into videos. That gives it a reason to want video documentation to grow. This report therefore labels every modeled figure, links every published source and states its limits, so readers can judge the estimates for themselves.
Limitations of this research
The main limitation of this research is that it is a model. Nobody crawled a help center to produce these numbers. The estimates show what the market likely looks like given published benchmarks, and they can be wrong. Treat each number as a starting hypothesis, not as an observed count.
The model also sees only public content. Many SaaS companies keep help content behind a login or inside the product. The model may undercount those videos. It also does not split results by SaaS category, region or funding stage.
The next edition will be a measured study. It would crawl SaaS help centers and check 300 to 500 companies by hand. It would also survey the people who run documentation and customer education. If your team wants to share data or hear about the results, use the contact page on this site.
How to cite and use this data
You can quote any number or reuse any chart from this report for free under a Creative Commons Attribution 4.0 licence. Please link back to this page and say that the figures are modeled estimates. Each section heading on this page has its own anchor, so you can link straight to the finding you cite.
Suggested citation. GuideClarity, SaaS Video Documentation Report, a 2026 market model, guideclarity.com/blog/video-documentation-saas-report
To embed a chart, copy the code below and replace the image file name with the chart you want.
<a href="https://guideclarity.com/blog/video-documentation-saas-report"><img src="https://guideclarity.com/images/gc-blog/video-documentation-saas-report/saas-help-articles-with-video.webp" alt="About 6 in 100 SaaS help articles include a video" width="1536"></a>
<p>Source: <a href="https://guideclarity.com/blog/video-documentation-saas-report">GuideClarity SaaS Video Documentation Report</a></p>
Full data tables
The full data tables below hold every value plotted in this report, rounded to whole numbers. Shares may not add up to exactly 100 because of rounding. Values from the model are modeled estimates. The two tables from Wyzowl are published survey results. Use these tables when you need an exact figure, and keep the modeled label next to it.
SaaS video documentation at a glance
| Value | |
|---|---|
| publish at least one user-facing video | 31% |
| run a structured video library | 9% |
| of public help articles include a video | 6% |
| of dated video-covered articles show a 90+ day freshness gap | 35% |
Businesses use video, but rarely for support or training
| Value | |
|---|---|
| Use video as a marketing tool | 91% |
| Customer service videos | 24% |
| Training videos | 23% |
| Customer onboarding videos | 23% |
People would rather watch than read
| Value | |
|---|---|
| Short video | 63% |
| Text-based articles | 12% |
Few SaaS companies get past a handful of videos
| Value | |
|---|---|
| 1+ videos | 31% |
| 5+ videos | 20% |
| 10+ videos | 14% |
| 20+ videos | 10% |
| 50+ videos | 5% |
| 100+ videos | 3% |
Most SaaS video libraries are small
| Value | |
|---|---|
| 1 to 4 | 37% |
| 5 to 9 | 17% |
| 10 to 19 | 13% |
| 20 to 49 | 16% |
| 50 to 99 | 9% |
| 100 to 249 | 6% |
| 250+ | 3% |
Video adoption climbs with company size
| At least one user video | Structured library | |
|---|---|---|
| 1 to 10 employees | 17% | 2% |
| 11 to 50 | 25% | 5% |
| 51 to 200 | 36% | 11% |
| 201 to 500 | 44% | 17% |
| 501 to 1,000 | 51% | 22% |
| 1,001+ | 58% | 28% |
About 6 in 100 help articles include a video
| Value | |
|---|---|
| of help articles contain or link a relevant video | 6% |
Most documented companies have no video coverage
| Value | |
|---|---|
| 0% | 64% |
| 0.1 to 5% | 15% |
| 5 to 10% | 8% |
| 10 to 25% | 7% |
| 25 to 50% | 4% |
| 50 to 75% | 1% |
| Over 75% | 1% |
What SaaS companies make help videos about
| Value | |
|---|---|
| Feature how-to | 32% |
| Getting started and onboarding | 22% |
| Workflow tutorial | 16% |
| Integration setup | 11% |
| Troubleshooting | 8% |
| FAQ and support | 5% |
| Advanced training | 4% |
| Product update | 3% |
YouTube hosts almost half of SaaS help videos
| Value | |
|---|---|
| YouTube | 49% |
| Vimeo | 14% |
| Loom | 10% |
| Wistia | 8% |
| All other hosts | 19% |
A third of video-covered articles outgrew their video
| Video same age or newer | Article 1 to 90 days newer | 91 to 365 days newer | Over 365 days newer | |
|---|---|---|---|---|
| About 68,000 dated video-covered articles | 51% | 14% | 18% | 16% |
Few SaaS companies reach structured video documentation
| Value | |
|---|---|
| None | 69% |
| Experimental | 11% |
| Developing | 10% |
| Structured | 6% |
| Advanced | 2% |
| Video-first | 1% |
Frequently Asked Questions
What is video documentation?
Video documentation is product help delivered as video instead of, or next to, written text. In SaaS it covers getting started videos, feature walkthroughs, workflow tutorials, integration guides and troubleshooting clips for existing users. Marketing videos, testimonials and sales demos are not video documentation, because they do not help a customer finish a task.
How many SaaS companies use video documentation?
A modeled market scenario of 10,000 SaaS companies estimates that about 31 percent publish at least one user-facing video. Only about 9 percent run a structured video library. These are modeled estimates informed by published benchmarks, not crawl results, so treat them as a reasoned starting point.
What share of SaaS help articles include video?
The model estimates that about 6 percent of public SaaS help articles include a relevant video. That leaves about 94 percent text only. Among companies with public docs, about 64 percent have no video in any article, so most of the market has no video coverage at all.
What is a video documentation freshness gap?
A freshness gap is the time between a help article's last update and the date of its video. A long gap suggests the product changed while the video stayed the same. The model estimates about 35 percent of dated video-covered articles have a gap of 90 days or more.
Why do SaaS companies not make more help videos?
The main barrier is maintenance, not interest. Text can be fixed in minutes, while a video usually needs a new recording, edit, narration and upload after each interface change. Smaller teams also lack the hours. That is why the model shows video adoption rising steeply with company size.
Is this data measured or modeled?
This edition is modeled. The company-level figures come from a modeled market scenario informed by published research such as the Wyzowl 2026 survey. Nobody crawled help centers for this edition. A measured edition that crawls help centers, checks companies by hand and surveys practitioners will replace these estimates.
Sources
- Wyzowl, Video Marketing Statistics 2026, a survey of 266 respondents in late 2025.
- Absorb Software and Lighthouse Research and Advisory, State of Customer Education 2026, with 502 complete survey responses.
- Absorb Software, customer education maturity findings, on self-reported versus tested maturity.
- Navattic, State of the Interactive Product Demo 2025, covering more than 28,000 demos and 280 surveyed users.